![]() IEQ Survey
IEQ Survey
Measuring Inclusion and Engagement
According to recent research by Gallup Inc., 70 percent of American workers are not engaged in their work. Of that number, 18 percent are actively resisting what the organization is trying to get done!
These distressing statistics show how big the need is for organizations of all sorts to transform how they engage people across all levels and functions. Gallup’s research shows that engagement drives greater business productivity, lower turnover, and better work quality.
Statistics like these explain why achieving high levels of engagement often is a leadership priority.
Unfortunately, the vast majority of people at all organizational levels have not developed the expertise to include and engage others effectively. To assess what we are calling Engagement Expertise, we have created two new key performance indicators (KPI):
- One measures the Engagement Expertise of individuals
- The second measures and illustrates the Engagement Expertise of entire groups – teams, departments, functions, or entire organizations
- Both serve as diagnostic tools that identify what needs to be changed or improved
We call these indicators Inclusion and Engagement Quotients, or IEQs – not IQ or EQ, but IEQ because engagement must be preceded by inclusion.
While broad engagement metrics such as Gallup’s are useful in grasping the scope and significance of the problem of disengagement, they are measurements of the outcomes or consequences of the inability to engage people. In contrast, IEQs measure the ability to engage directly and therefore are useful and to the point of what needs to change in order to build the expertise for achieving higher levels of engagement across the board.
Individual IEQ
An individual’s IEQ is the score achieved from answering a simple questionnaire (Table 3.2). The questionnaire can be self-administered, filled in through observations, or done through a 360-degree process. The range of possible scores is from zero to ten. The answers also provide an immediate diagnosis of which practices need to be changed to improve engagement expertise.
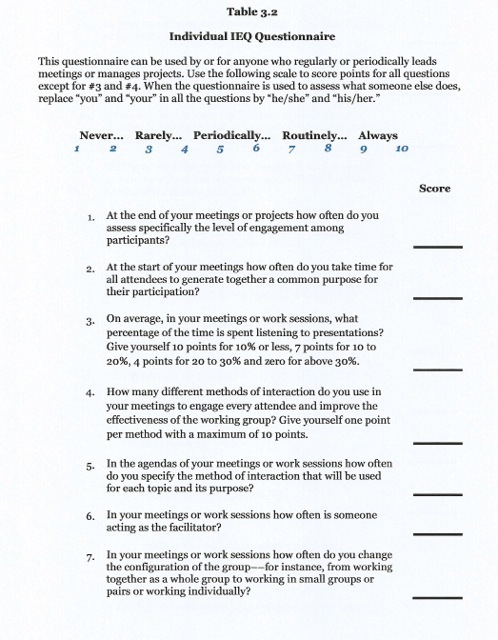
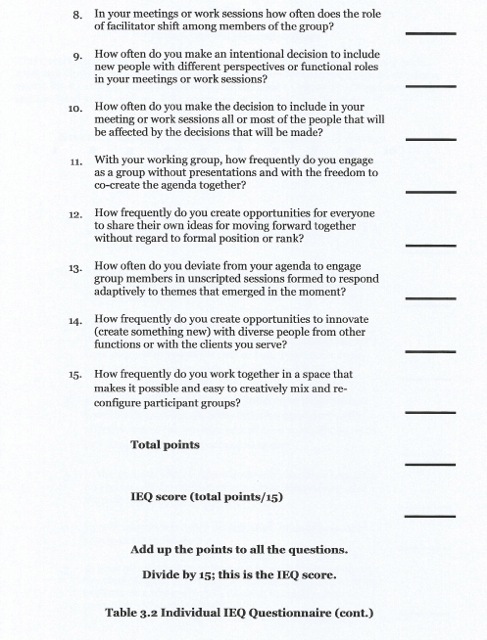
Table 3.2
Individual IEQ Questionnaire
This questionnaire can be used by or for anyone who regularly or periodically leads meetings or manages projects. Use the following scale to score points for all questions except for #3 and #4. When the questionnaire is used to assess what someone else does, replace “you” and “your” in all the questions by “he/she” and “his/her.”
Group IEQ
A group IEQ is derived from plotting the cumulative distribution of the individual IEQs of all group members, as illustrated in Figures 3.4 through 3.6 below. The Group IEQ is obtained by measuring the area under the curve; it can range from zero to ten. Figure 3.4 illustrates a “perfect” group IEQ: 100 percent of its members have individual scores of ten.
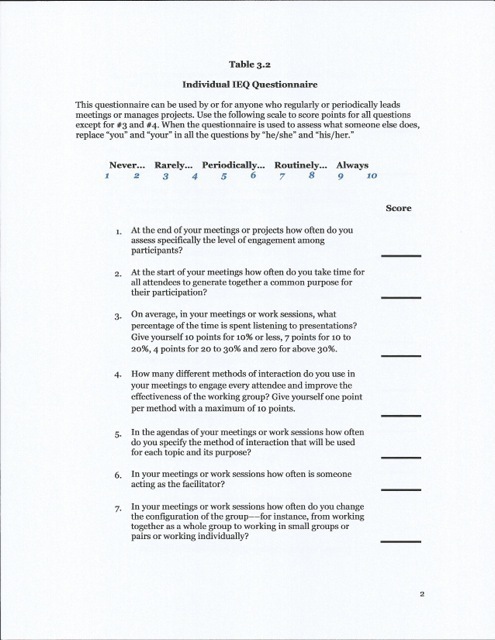
Figure 3.4
IEQ Distribution for a Perfect Group
IEQ of a Group Using Conventional Microstructures
In the example illustrated in Figure 3.5, the Group IEQ is approximately 2. The curve illustrates the distribution for an organization where only a select group of people have developed a high level of Engagement Expertise, either from natural talent or specialized training. Everybody else is using the Big Five conventional microstructures.
In such an organization, only a small percentage of people have IEQ scores of five or more (in this example, about 10 percent). The vast majority have IEQ scores of less than five (in this example, about 90 percent) and a large proportion have scores between zero and one (in this example, 50 to 60 percent). The resulting IEQ curve is deeply concave, which is typical of an organization where the majority of people use traditional structures for meetings and for working together.
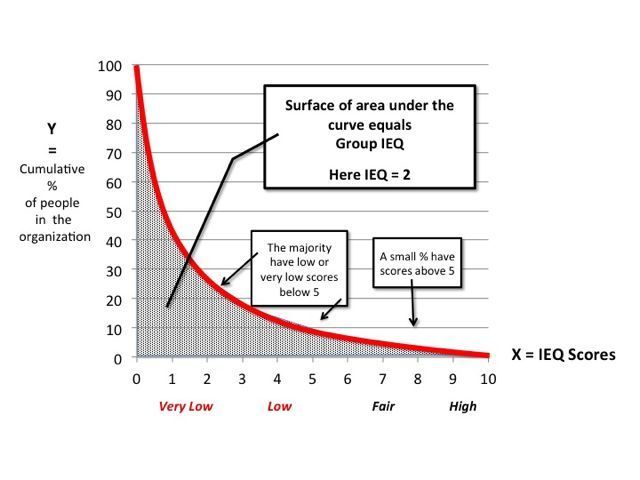
Figure 3.5
IEQ Distribution for a Group That Uses Conventional Microstructures
IEQ of a Group Using Liberating Structures
Since Liberating Structures are easy to learn, it is simple for everybody to quickly boost his or her Engagement Expertise and bring individual IEQs above five. This makes it possible for a group of any size that chooses to use Liberating Structures routinely to flip their IEQ curve from concave to convex. In such an organization, Liberating Structures help everybody – senior leaders, managers, frontline people – to include and engage others effectively.
Figure 3.6 illustrates the IEQ for this kind of organization, where the vast majority have IEQ scores of five or above (in this example, about 88 percent) and only a small percentage have IEQ scores below five (in this example, about 12 percent). The resulting concave curve generates a large area under it and thus a high Group IEQ, in this example an IEQ of approximately eight.
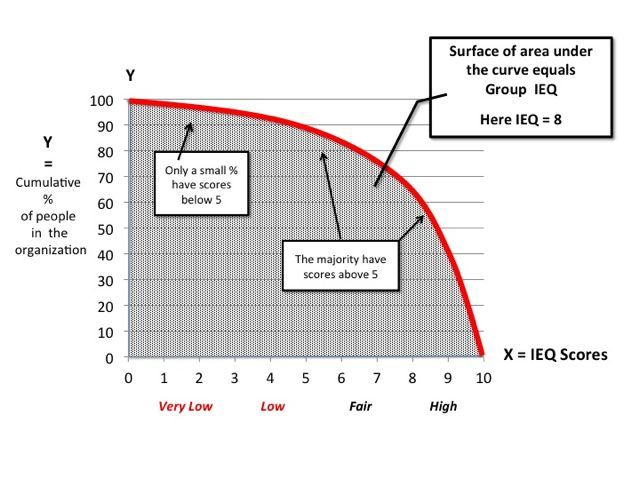
Figure 3.6
IEQ Distribution for a Group That Uses Liberating Structures Routinely
With the information from individual and group IEQs, you know where you stand; you have a clear picture of what needs to be done to transform the way people collaborate, how they learn, and how they discover solutions together. As you implement changes, IEQs give you convenient metrics to track progress and identify where to focus your efforts. If people in your group start using Liberating Structures on a routine basis, you will be surprised how dramatically the group’s IEQ curve will flip.
This is one of the reasons why we say Liberating Structures are a disruptive innovation: no one expects such surprising results and impact on what is a pervasive challenge.